Team drivesDNA™
Teams work best where team members build on each others’ strengths. Spiral Drives shows you the underlying patterns so you can optimize team dynamics. This is THE route to vital and successful teams.
The route to vital, successful teams
The definition of a team is clear and simple: a group of employees brought together to carry out a task in an organization. Everyone has their own role and tasks, based on competences and “fit”.
This definition of a team sounds simple, the reality of team dynamics is way more complex. It can raise teams to great heights, but also send them in the completely opposite direction. Dynamics come about in the interaction between team members. They show up in behavior (the visible factor) and are controlled by drives (the invisible factor). Team dynamics are the number one factor affecting vitality and effectiveness in teams.
Because team dynamics always originate in interactions, team development always starts with individuals. Awareness of and responsibility for your own drivesDNA™ is an essential first step for effective team development.
The Team drivesDNA™ combines the staff members into one snapshot, no more and no less. This gives you a clear view of potential strengths and tensions. It shows where drives are equal or unequal. Both of these situations have their own advantages and disadvantages.
Wherever team members clash, tensions arise, and strengths cannot fully flourish. If team members strengthen each other, this can lead to a strong team, but there are still risks involved.
When you investigate these two areas with the team, their potential for development becomes clear and concrete. The team can take steps in the right direction in a fun and effective way. Tensions are turned into strengths, drives become better balanced and teams become more vital and effective.
- team dynamics strengthen or weaken teams
- seen in behavior (visible), controlled by drives (invisible)
- team development starts with individuals (individual drivesDNA™)
- the Team drivesDNA™ combines these into one clear snapshot
- shows areas of strengths and potential tensions
- offers concrete strategies for team development
- leads to optimal use of diversity
- THE route to vital and successful teams
What does Team drivesDNA™ consist of?
At its core, the Team drivesDNA™ consists of two different diagrams showing the preference, resistance and energy balance in the team:
- team average (average score per drive in the team)
- team diversity (individual scores shown in one team snapshot)
The diagram of the team average is the same as the team results of almost all other Graves suppliers, including Management Drives and Profile Dynamics. Sometimes the only difference is the form: a pie chart instead of a bar chart.
The team average shows the average preference of a team. This is good for an overall impression, but that’s about it; the team average does not show anything of the underlying team dynamics. As a result, it offers hardly any clues for concrete team development.
The team average also says nothing about culture or other deeper elements in a team. In our approach, culture is way more than a total sum of individual drive preferences. It works at a deeper level, that of the Collective drivesDNA™.
The real power of the Team drivesDNA™ lies in the diversity diagram. It combines all the individual scores into one anonymous snapshot. It shows how much individual scores converge or diverge per drive.
Diversity is a source of potential strength. Our instruments make this visible, so you can activate this potential strength.
This is an example of a diversity diagram:
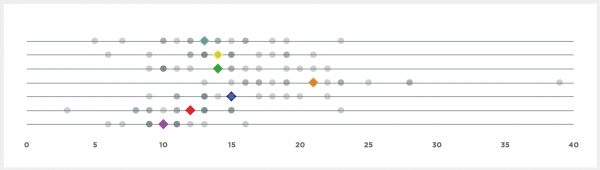
The diagram shows all of the individual scores in one unique diagram. It may look relatively simple, but appearances can be deceptive. It includes masses of information and clues for development. SD Experts know how to read and use this as input for concrete team development.
The diversity diagram is a good example of how research, development and design come together in our approach.
Instrument specifications
TEAMDRIVES
7 constructs, based on the research of Clare W. Graves (purple through turquoise)
MEASUREMENT METHOD
n/a
NUMBER OF QUESTIONS
n/a
TIME REQUIRED TO COMPLETE
n/a
MINIMUM NUMBER OF PARTICIPANTS
2
MAXIMUM NUMBER OF PARTICIPANTS
unlimited
APPLICATIONS
Teams, groups of employees brought together to carry out a task together in an organization
RESULTS
Compact, three* pages of diagrams (A4 pdf), each with two diagrams (*five pages of diagrams in the case of drivesDNA Plus)
REQUIRED Education
SD Team Module
How do you use the Team drivesDNA™?
Your first step in effective team development is always the individual drivesDNA™. The Team drivesDNA™ is then built up from the results of the Individual drivesDNA™.
The Team drivesDNA™ has no instrument specifications of its own. As a SD Expert, you generate it with a simple click of a button, at no extra cost.